



Moscow Sport · Analytics
Who is on the field, counted by cameras.
An analytics platform for the Moscow Department of Sport: attendance of the city’s sports facilities measured from camera footfall and compared with the planned schedule of training sessions. Organisations, facilities and zones as a hierarchy, access by role, and charts from a five-minute grain up to a month. Web, light and dark.
- Platform
- Web
- Released
- 2024
- Solution
- Computer vision
- Tags
- Web / Analytics / Computer vision
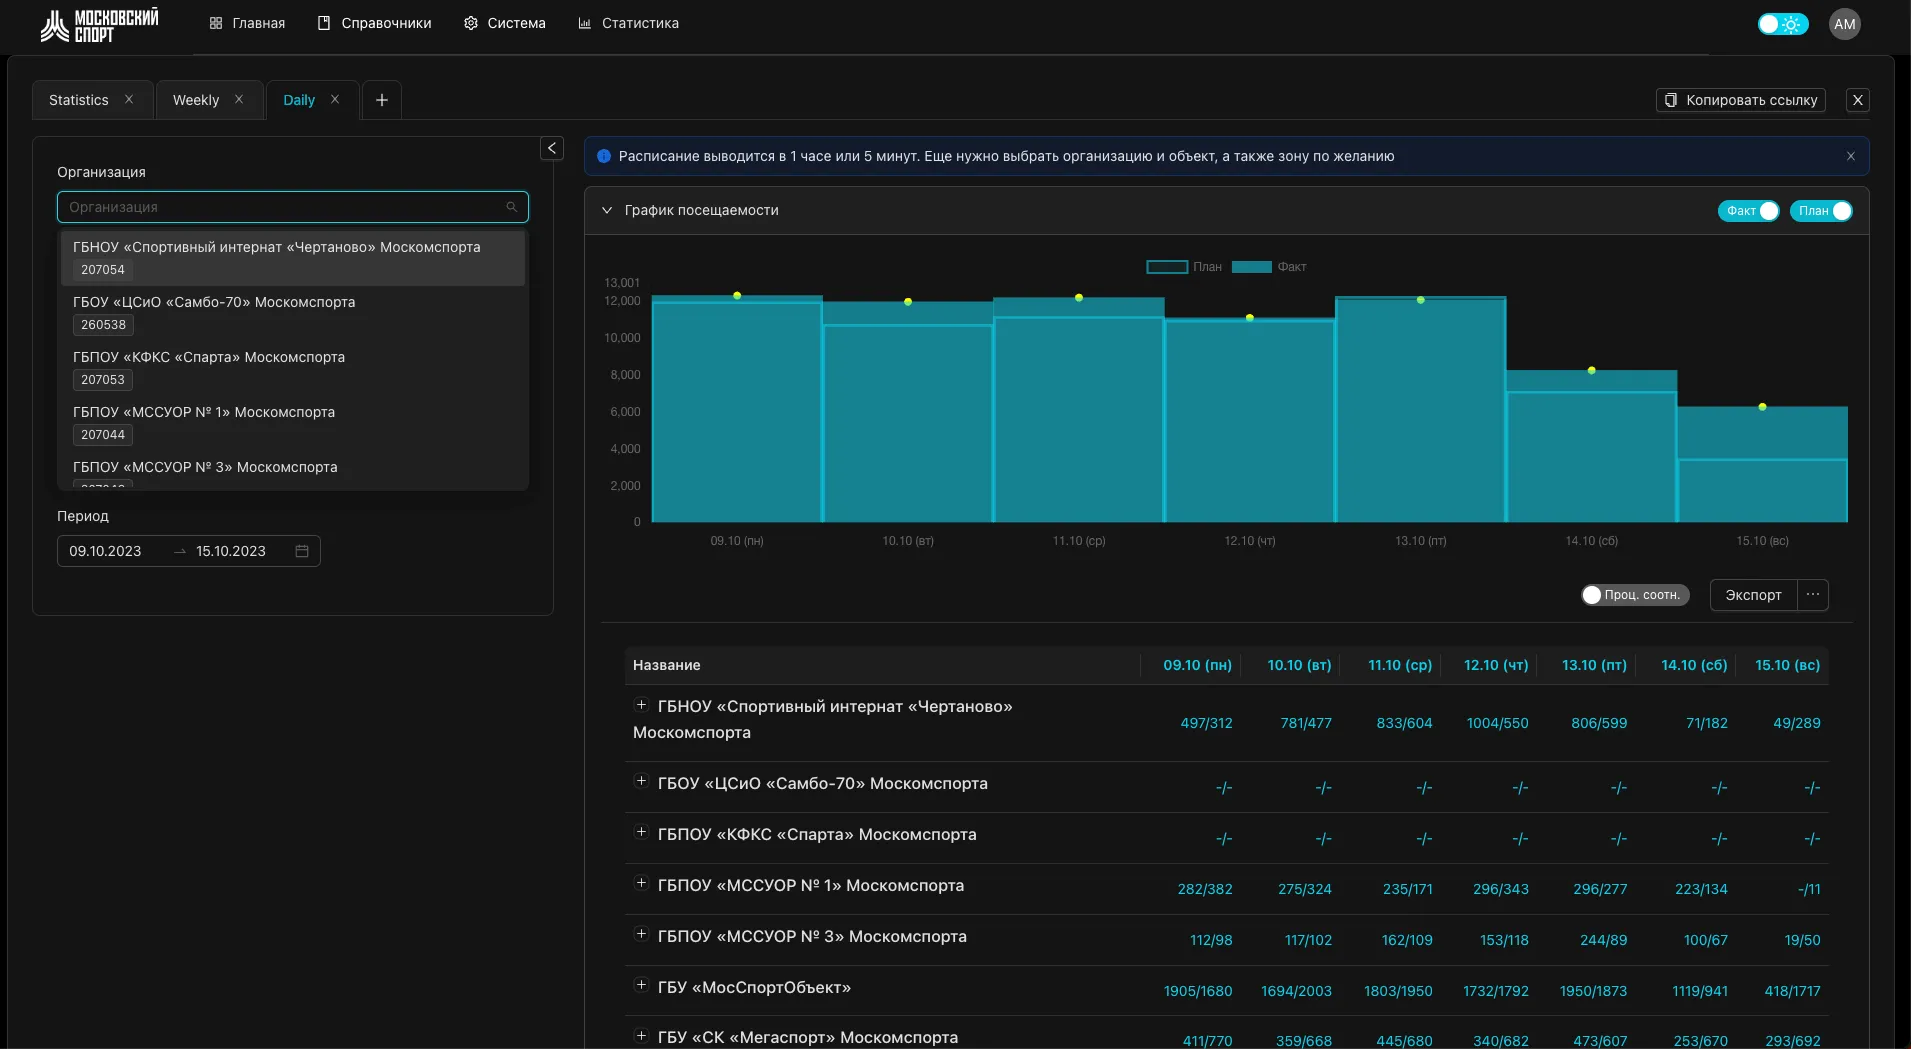
Plan against fact, per facility
The platform’s job is to show how much a facility is actually used: camera counts against the events booked on it. The dashboard puts the planned and the measured attendance side by side for every organisation, with a chart above and a table underneath, and exports to a spreadsheet.
Directories and access
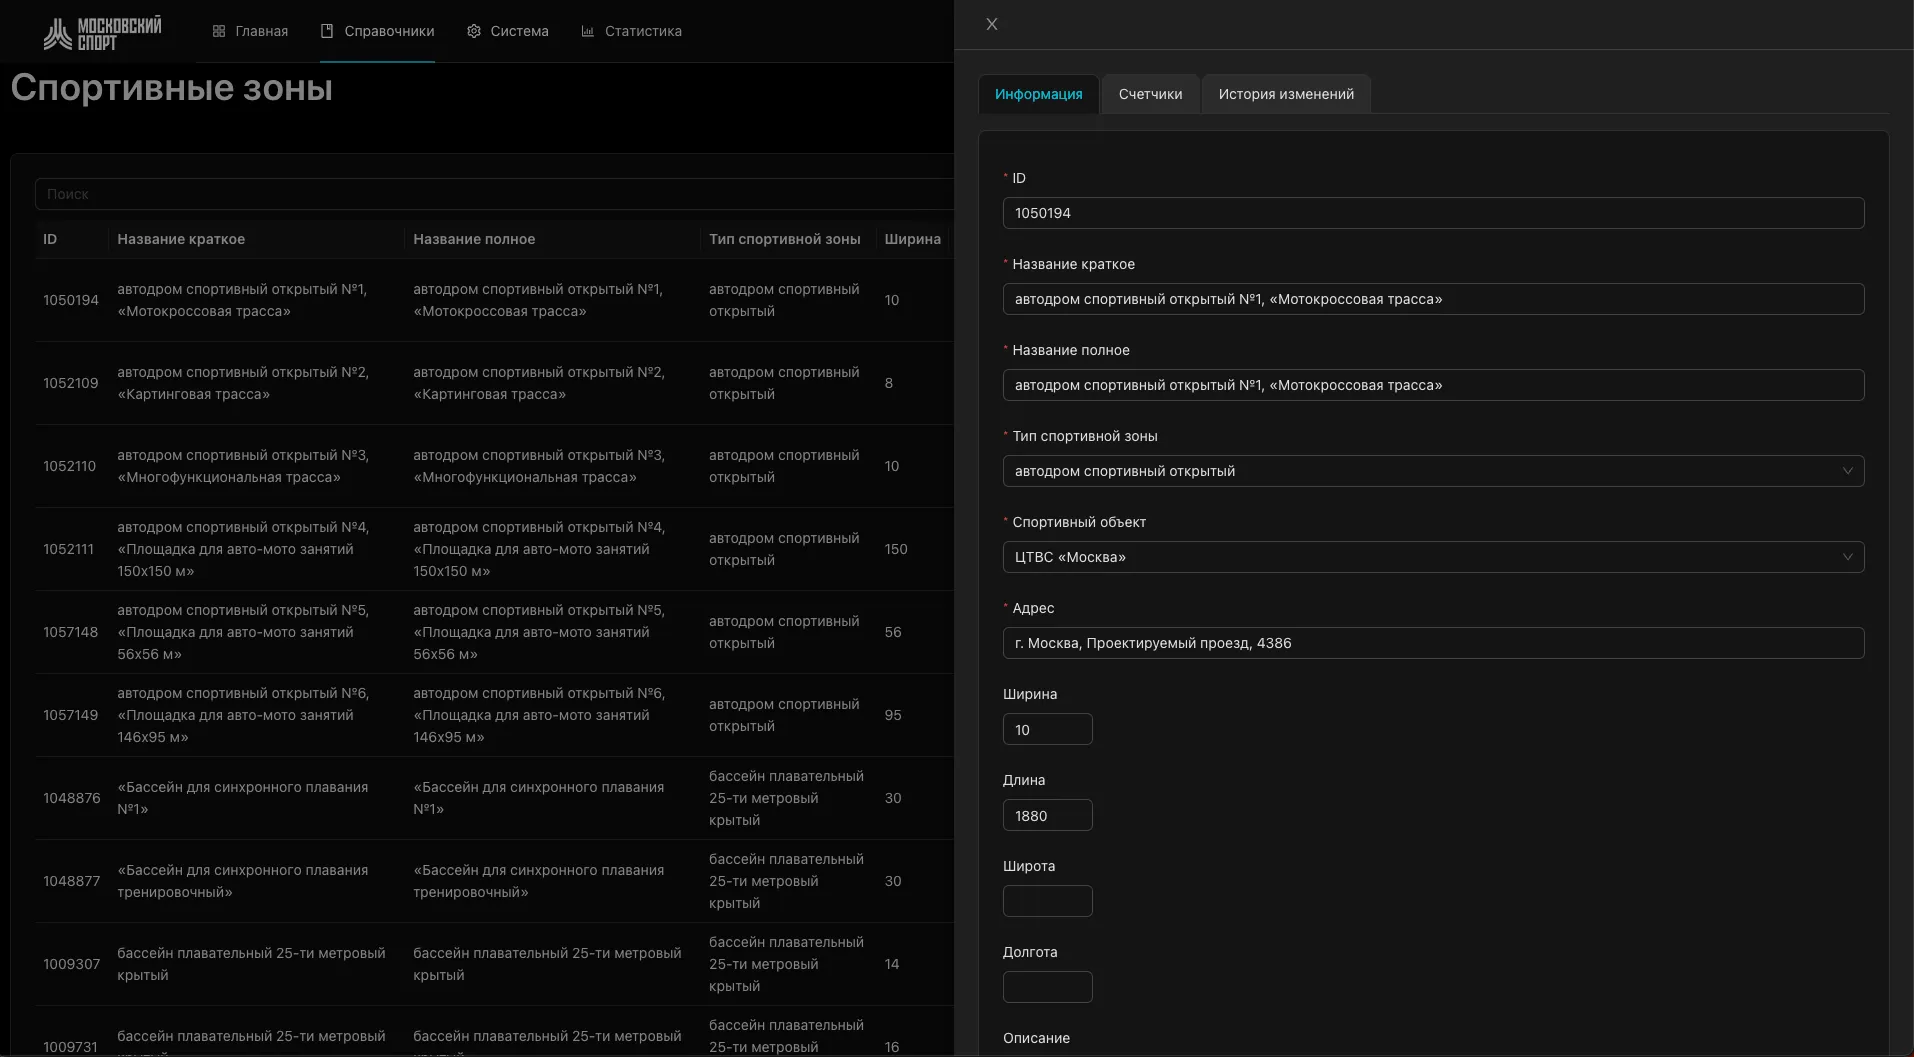
Organisations, facilities and control zones were imported from the city registers, each zone with its type, dimensions, address and camera counters, and a full change history. Every user gets access by operation, by organisation and by facility, so a school sees its own halls and the department sees the city.
From five minutes to a month
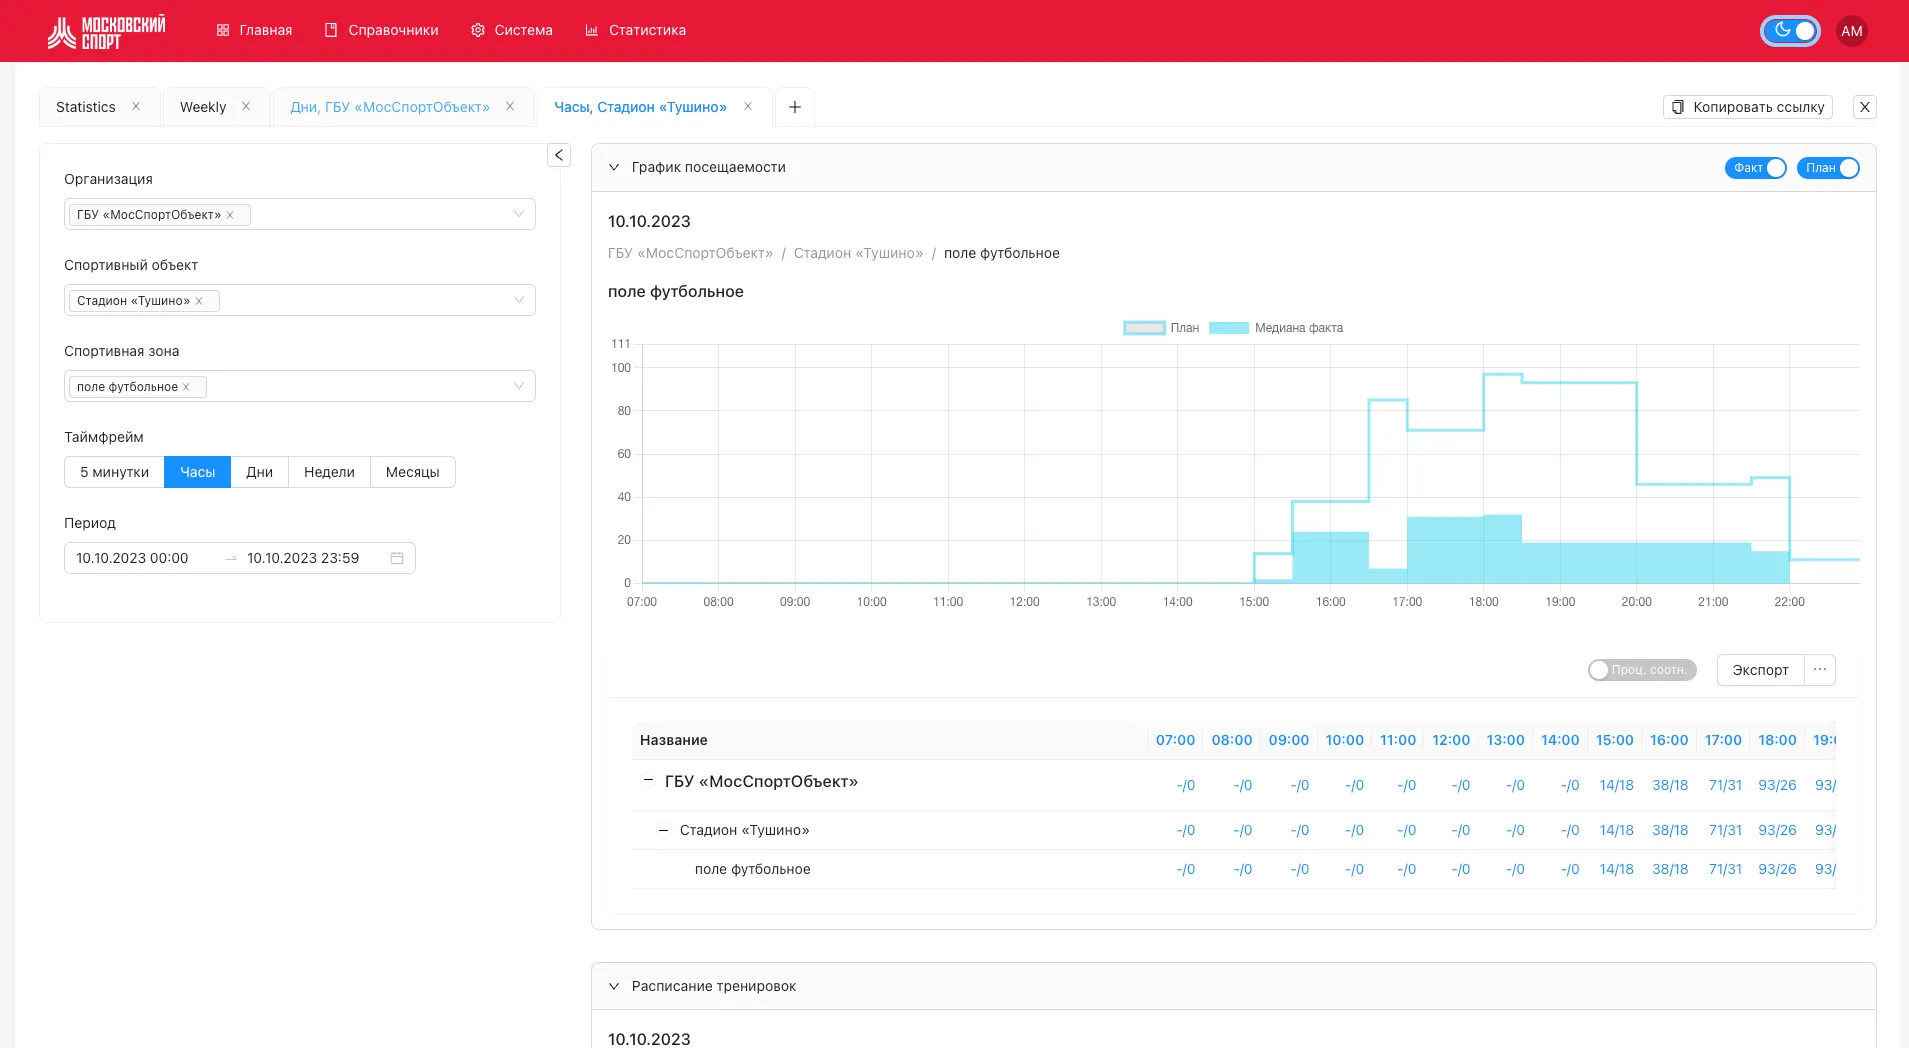
Analytics follows the access you hold. Drill down by organisation, facility, zone and date range, then switch the grain: five minutes, hours, days, weeks or months. A day of one football field shows the plan as steps and the measured median filling underneath.
Events crossed with cameras, in saved tabs
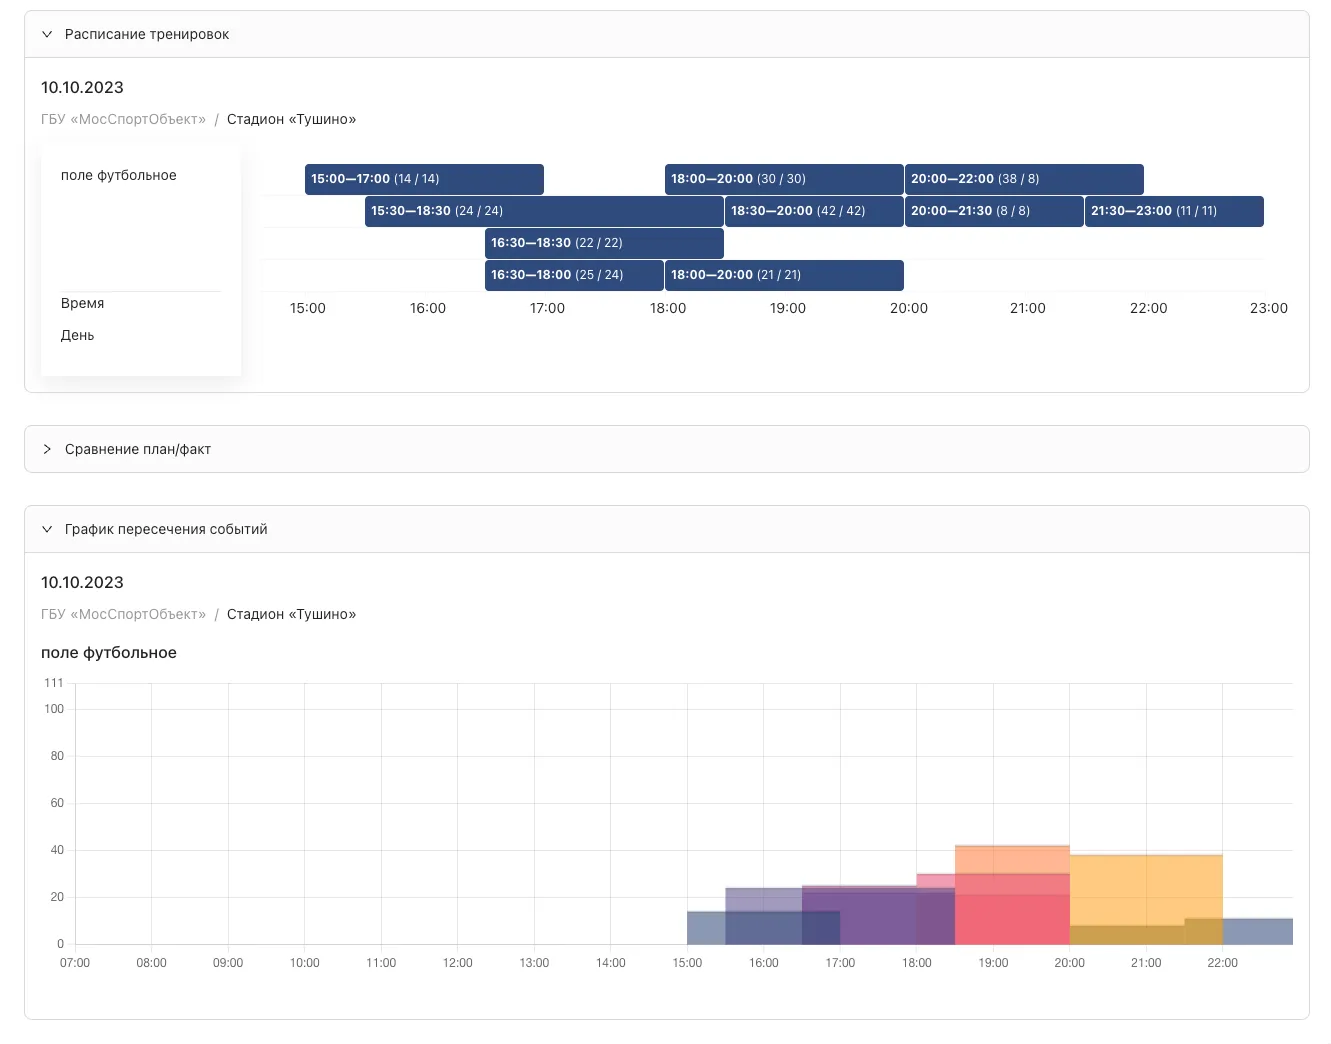
The training schedule and the camera data meet on one timeline: sessions as bars with planned and counted attendance, and an overlay chart where events intersect. Work usually spans several facilities, so views live in tabs that can be saved and shared with colleagues as a link with all the settings inside.
The platform, screen by screen
Dashboards, zones, hourly charts and schedules: the screens the Department of Sport works with every day.